
Condo Market Statistics in 2026
The condo market is changing in many places. Prices, supply, demand, and buyer behavior do not move the same way in every city or country. That is why current numbers matter. They help people understand what is happening now and what may affect their next move.
This guide brings together useful condo and real estate statistics for 2026 in one place. It will look at prices, inventory, affordability, buyer activity, and market direction. Each section will explain what the numbers show and why they matter for people who want to rent, buy, invest, or follow the market more closely.
Real estate market overview in 2026
The condo market in 2026 is active, but it is not simple. In many places, prices are still high, even when growth has slowed. Buyers are paying close attention to monthly costs, loan rates, building quality, and location. Renters are also being more careful, especially in cities where housing costs remain hard to manage. At the same time, some markets have more listings than before, which gives people a bit more choice.
This year, the market is shaped by a mix of pressure and adjustment. Some cities still have strong demand because people want to live near work, transport, schools, or services. Some areas are seeing slower movement because buyers want better value before they commit. That is why 2026 is a year worth watching closely. In the next sections, we will look at the numbers behind prices, supply, demand, and affordability.
How we chose these statistics?
We chose these statistics based on how useful they are for people trying to understand the condo market in real life. Some numbers may look interesting, but not all of them help readers make better decisions. That is why this guide focuses on statistics connected to price, supply, demand, affordability, rent levels, and buyer activity. These are the areas that often shape what people see when they search, compare, or plan their next move.
We also gave more value to recent data and to sources that are widely used in real estate research, reporting, or market tracking. The goal was not to collect as many numbers as possible. The goal was to include statistics that help explain what is changing, where pressure is building, and what readers should pay attention to in 2026.
Price and market movement statistics in US 2026
Prices help people understand how hard the market is to enter. Market movement helps show whether buyers are active or pulling back. In 2026, both matter a lot. A market can stay expensive even when sales slow down. It can also stay active while buyers become more careful with money. That is why this section starts with one of the clearest housing signals. It shows how much inventory is on the market and what that can mean for people who want to buy a condo or follow broader property trends.
U.S. housing inventory reached 1.29 million units in February 2026 (Source: National Association of REALTORS®)
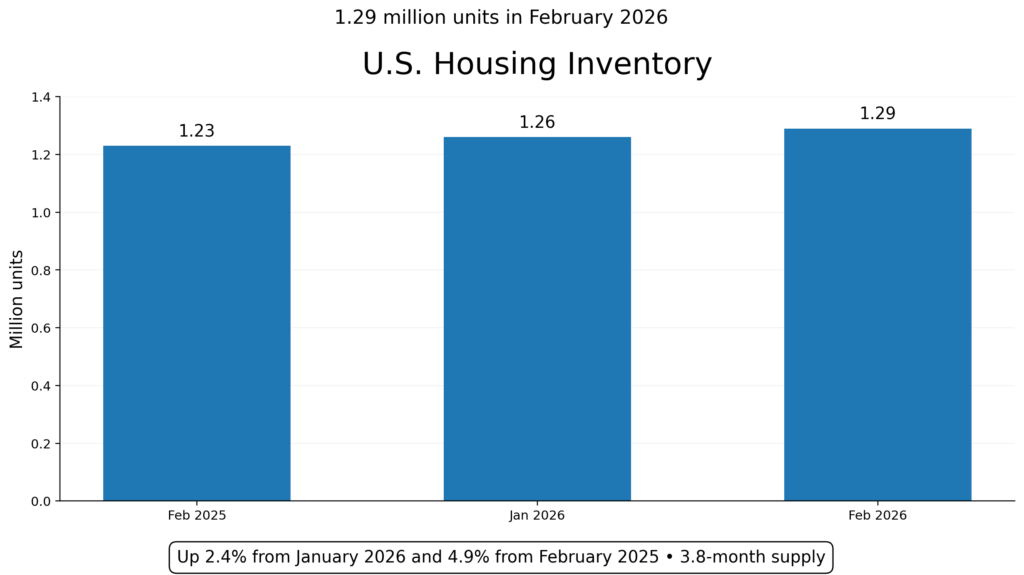
The National Association of REALTORS® reported that total housing inventory reached 1.29 million units in February 2026. That was up 2.4% from January and 4.9% from February 2025. The same report showed a 3.8-month supply of homes on the market. This matters because inventory affects buyer choice, seller pressure, and how quickly people need to act.
When more homes are available, buyers often get a little more room to compare options and ask better questions before making a decision. For condo buyers, this can be useful because it may become easier to compare location, building quality, fees, and value instead of rushing into one listing too early.
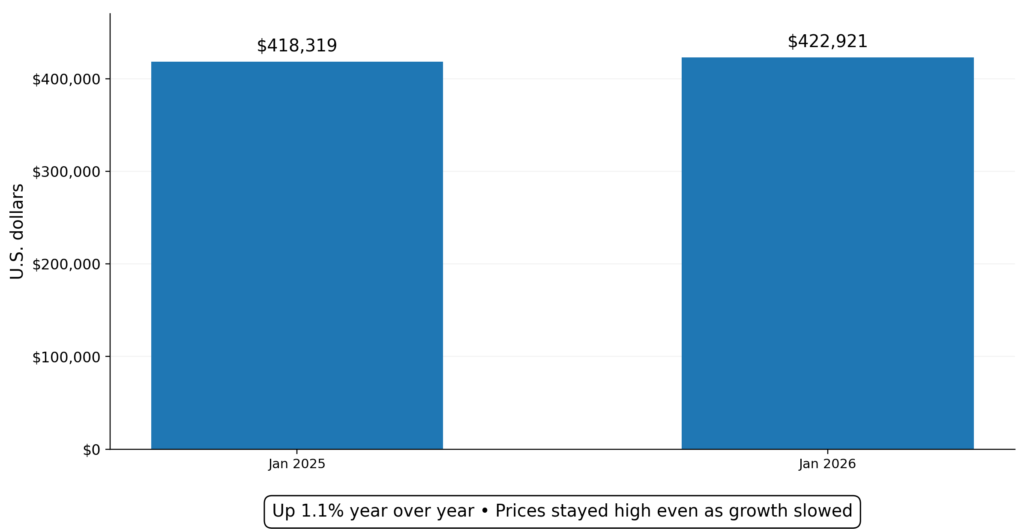
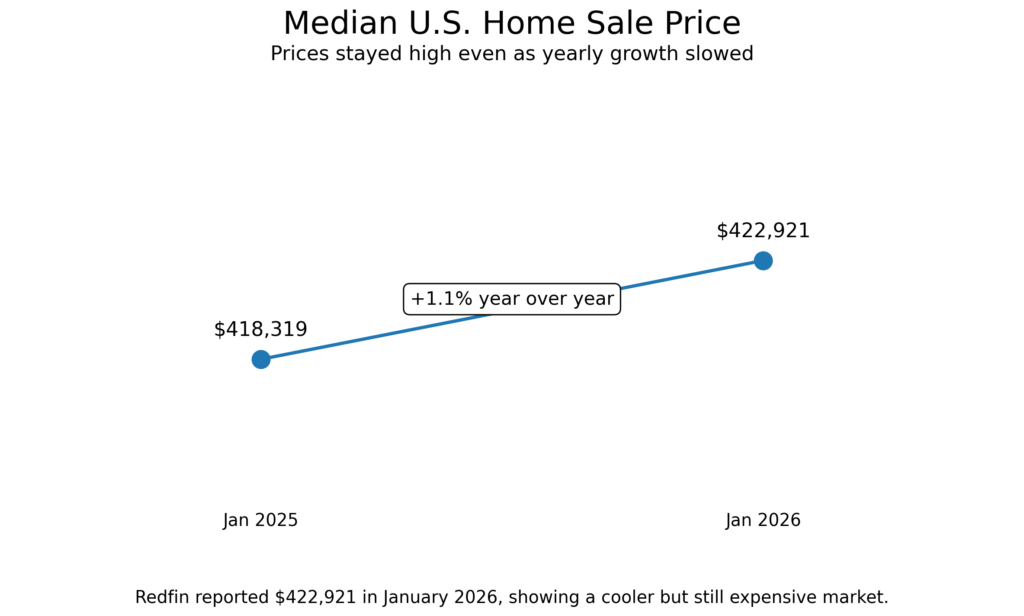
The median U.S. home sale price reached $422,921 in January 2026 (Source: Redfin)
Redfin reported that the median U.S. home sale price reached $422,921 in January 2026. That was up about 1.1% from a year earlier. The rise was not huge, but it still shows that prices remain high for many buyers. This matters because even slower price growth does not always make a market easy to enter.
People still need to think about monthly payments, down payments, and how much value they are getting for the price. For condo buyers, this kind of number is useful because it shows that the market may be cooling in speed without becoming cheap. In simple terms, prices are still holding up, even while buyers are becoming more careful and more selective about where they spend.
Home prices rose in 73% of U.S. metro areas in the fourth quarter of 2025 (Source: National Association of REALTORS®)
The National Association of REALTORS® reported that home prices increased in 73% of metro areas during the fourth quarter of 2025. The same update said the national median single-family existing-home price reached $414,900, which was 1.2% higher than a year earlier. This is important because it shows that price pressure is still present across much of the market, even if growth has slowed in some places.
It also reminds readers that real estate does not move the same way everywhere. Some cities are rising faster, while others are becoming more stable. For people looking at condos, this helps explain why local research matters so much. A broad national trend can be useful, but city-level movement often shapes the real decision more directly.
First-time buyers made up only 21% of the market in 2025 (Source: National Association of REALTORS®)
NAR’s 2025 Profile of Home Buyers and Sellers found that first-time buyers made up just 21% of the market. That was the lowest share since the group started tracking this measure in 1981. This number matters because it says a lot about affordability pressure. When fewer first-time buyers are able to enter the market, it usually means prices, financing, or savings requirements are still too hard for many households.
This also matters for condo readers because condos are often seen as a more reachable step into ownership. Even so, entry is still difficult in many places. This statistic helps show that the market is not only about demand. It is also about who can realistically afford to take part in it right now.
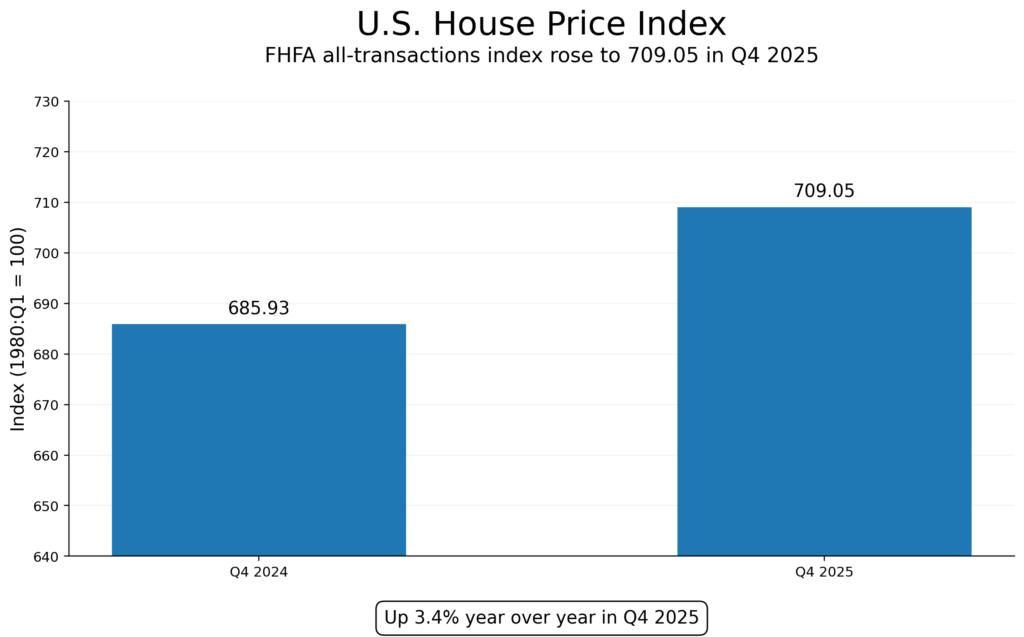
U.S. house prices were up 3.4% year over year in Q4 2025 (Source: FHFA via FRED)
The FHFA all-transactions house price index showed annual growth continuing into late 2025. This matters because price growth, even when slower, still affects affordability and buyer timing. It also helps explain why many buyers keep watching smaller units, condos, and city apartments as more reachable options than detached homes in high-cost areas.
European Union Housing and Price Statistics for 2026
The European Union housing market is moving upward in many places, but the pressure is not the same across the region. Some countries still have strong price growth. Some have higher housing stress than others. That is why EU-wide data is useful here. It gives a broader view before readers look at one country or one city.
The figures below focus on recent price movement, rent changes, housing cost pressure, and ownership patterns. These are worth watching because they can shape timing, budget planning, and how carefully people need to compare one market with another.
House prices in the euro area rose 5.1% year over year in Q3 2025 (Source: Eurostat)
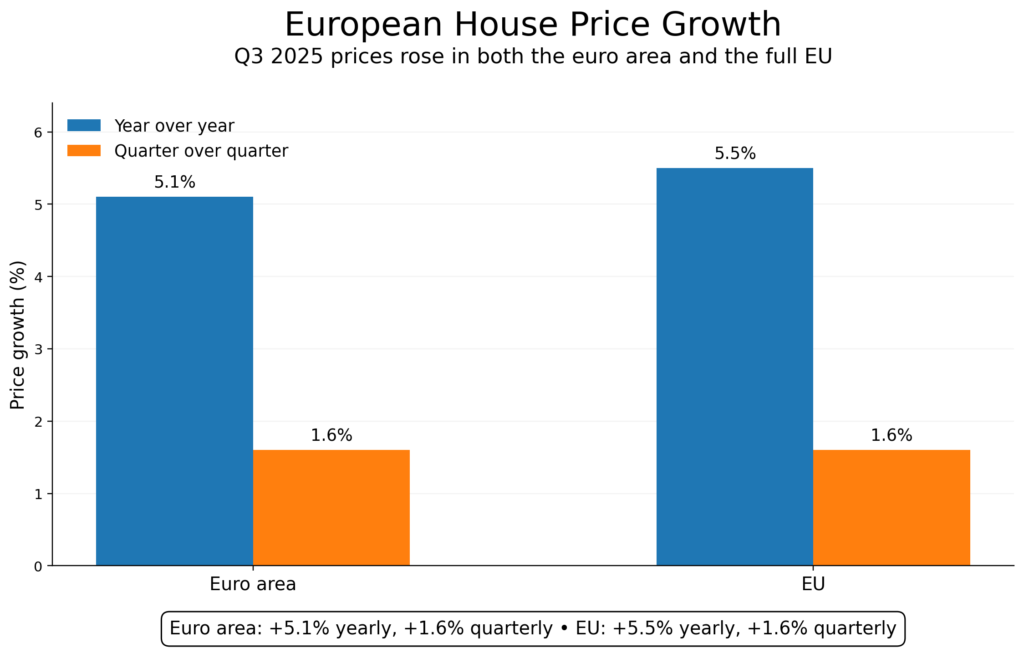
Eurostat reported that house prices in the euro area were 5.1% higher in the third quarter of 2025 than a year earlier. Across the full European Union, the increase was 5.5%. Compared with the previous quarter, prices also moved up 1.6% in both the euro area and the EU.
This matters because it shows that housing costs were still rising across much of Europe going into 2026. That may affect how people think about timing, especially if they hope prices will fall quickly.
It also means buyers should not rely on broad regional headlines alone. A market can still look expensive even when growth has slowed in some places, so the next step is to compare city-level and country-level conditions more closely.
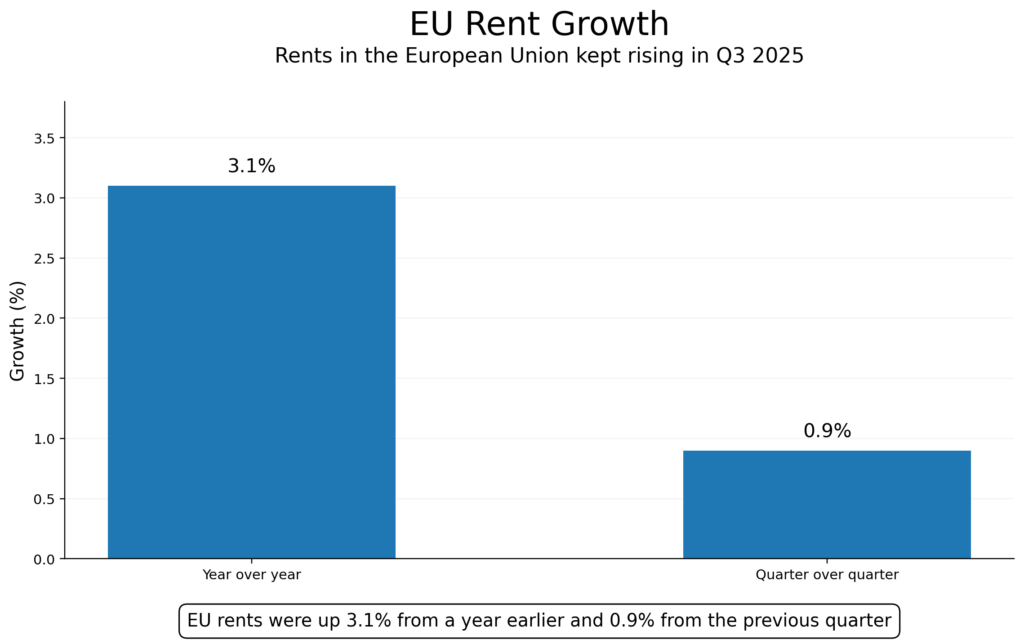
Rents in the European Union rose 3.1% year over year in Q3 2025 (Source: Eurostat)
Eurostat said rents across the EU were 3.1% higher in the third quarter of 2025 than a year earlier. On a quarter-to-quarter basis, rents rose 0.9%. This is useful because rent trends can show whether pressure is still building for people who are not ready to buy. When rents keep rising, some households may find it harder to save for a future purchase, even if home-price growth starts to cool. That can keep more people in the rental market for longer.
For someone comparing options, this number is a reminder to look at both sides of the housing picture. A slower buying market does not always mean renting becomes easy or cheap at the same time.
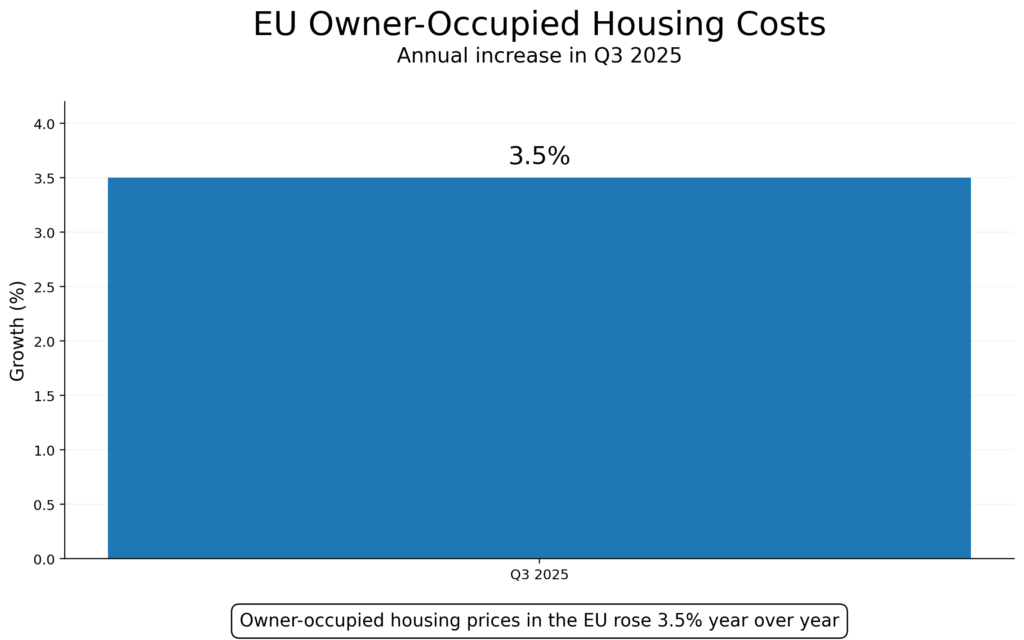
Owner-occupied housing prices in the EU rose 3.5% year over year in Q3 2025 (Source: Eurostat)
Eurostat’s owner-occupied housing price index showed a 3.5% annual increase in the EU in the third quarter of 2025. This measure is helpful because it looks beyond simple sale prices and tracks costs connected to homes people live in themselves. That makes it useful for readers who want to understand pressure on households, not only investor activity or transaction values. For buyers, this can be a sign that ownership costs are still moving upward even when headlines focus more on the general market slowdown.
It is worth paying attention to this because the full cost of ownership can shape long-term affordability more than the asking price alone. That is especially true in markets where borrowing, insurance, or upkeep are becoming more expensive.
About 68% of people in EU households owned their home in 2024 (Source: Eurostat)
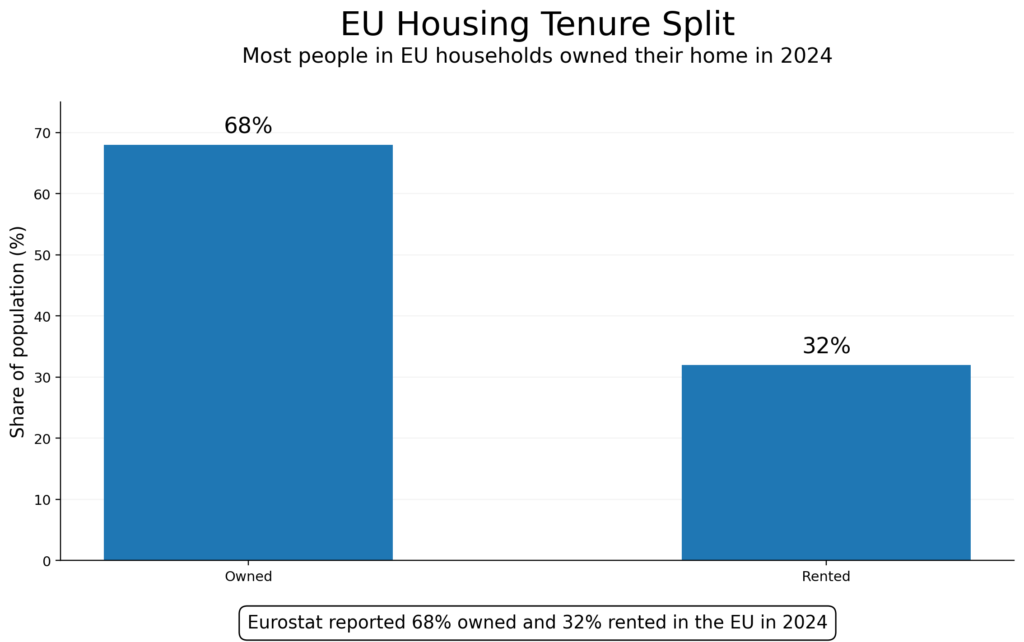
Eurostat reported in February 2026 that 68% of the population living in EU households owned their home in 2024, while 32% lived in rented housing. This matters because it gives useful context for how housing is split across the region. It also shows that renting remains a major part of the market, not a small side segment. For readers, that means housing policy, rent pressure, and tenant conditions still matter a lot when looking at Europe.
It can also help explain why some countries feel very different from others. A market with a high ownership share may not behave the same way as one where renting plays a larger role, so this is one more reason to compare national patterns before making decisions.
Nearly 10% of people living in EU cities faced housing cost overburden in 2024 (Source: Eurostat)
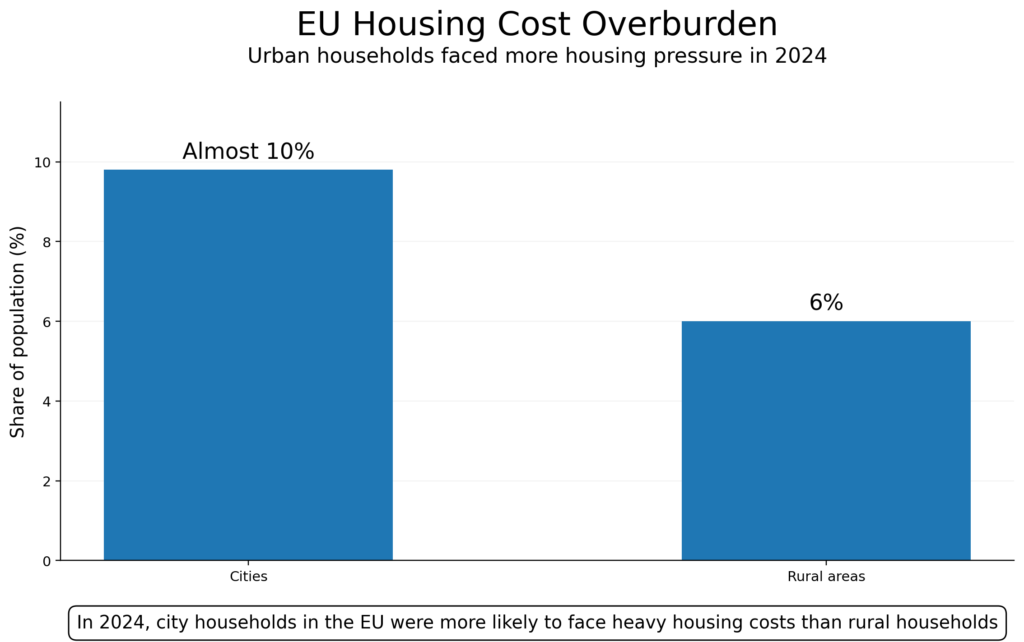
Eurostat’s 2025 housing publication said that in 2024, almost 10% of the population in EU cities lived in households with housing costs that were too heavy relative to income. The comparable figure in rural areas was 6%. This matters because city housing pressure often shapes condo and apartment demand most directly. When a larger share of urban households is stretched, buyers and renters may delay moves, lower their budgets, or shift toward smaller units and different locations.
For your readers, this is a useful sign to watch city affordability, not just headline prices. A market may still attract demand, yet the real question is whether people can carry the cost once housing, utilities, and other expenses are added together.
Singapore Condo Statistics 2026
Singapore remains one of the clearest condo markets to watch in 2026. Prices are still moving, but not at the same speed across all segments. Rent is shifting, too, and supply remains an important part of the story. That makes recent data very useful for anyone comparing timing, budget, or market direction.
The figures below focus on private condo prices, rent movement, resale flat prices, vacancy, and supply. Together, they can help show where pressure is easing, where it is still holding, and what people should check more closely before making a property decision in Singapore.
Private residential prices in Singapore rose 0.6% in Q4 2025 (Source: URA)
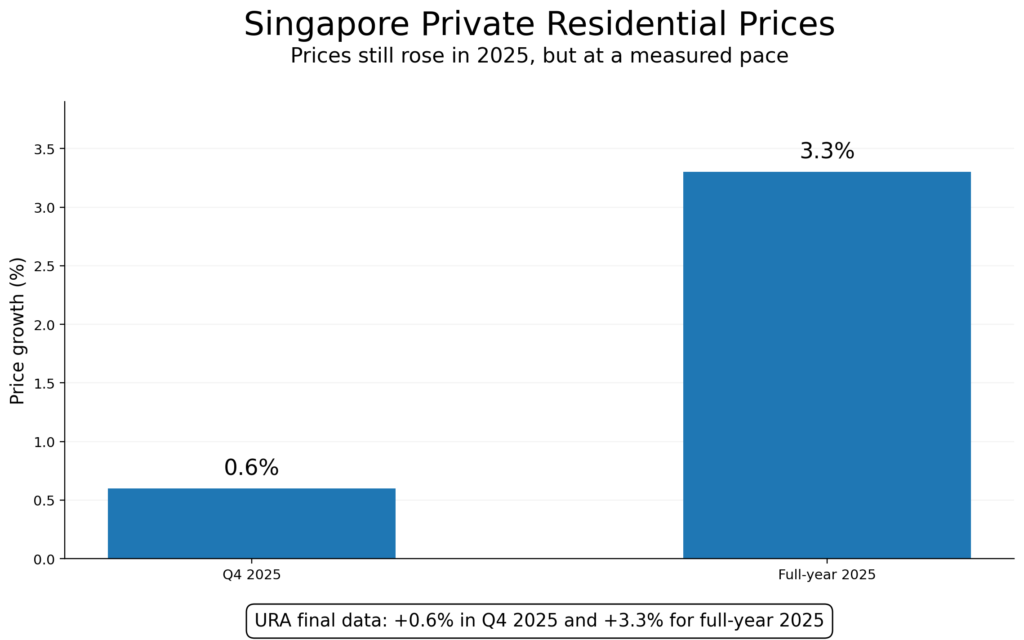
URA reported that private residential prices rose 0.6% in the fourth quarter of 2025, while full-year growth reached 3.3%. This shows that prices are still moving up, but at a measured pace. If you are comparing condos, this is a sign to look closely at value, district, and building quality instead of assuming all parts of the market are rising in the same way.
Non-landed private home prices in the Core Central Region fell 3.5% in Q4 2025 (Source: URA)
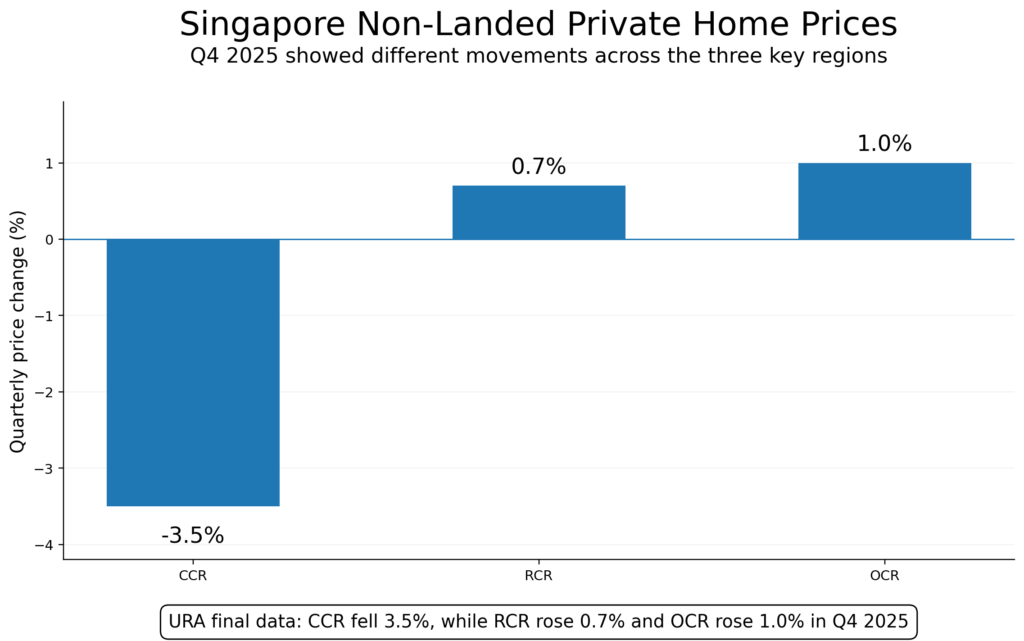
URA said non-landed private home prices in the Core Central Region fell 3.5% in Q4 2025, while the Rest of Central Region and Outside Central Region still rose. This matters because Singapore is not moving as one block. If you are choosing between areas, district-level movement may tell you more than one national headline.
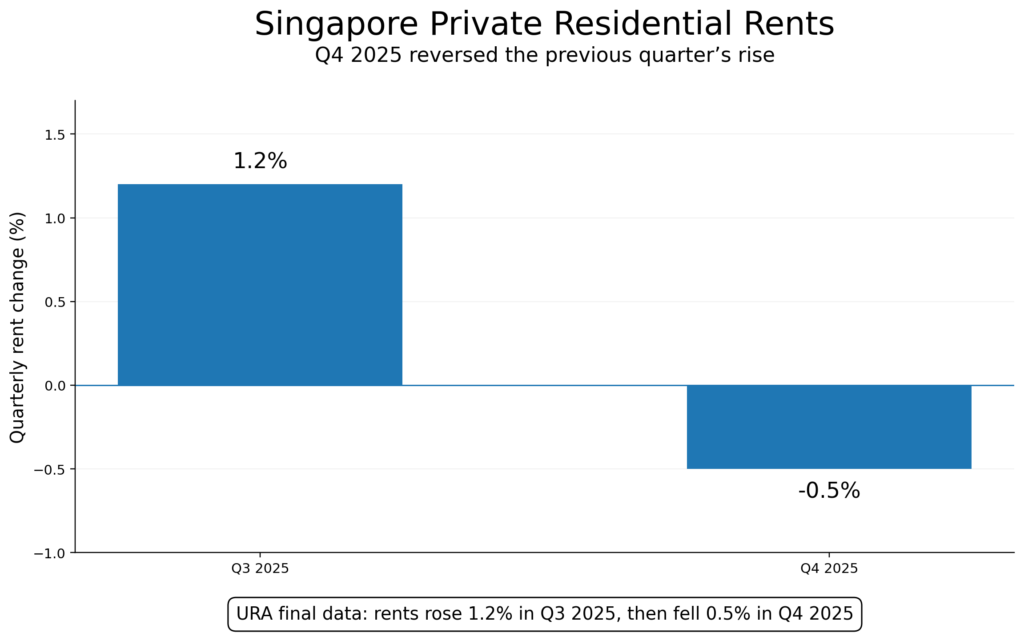
Private residential rents in Singapore fell 0.5% in Q4 2025 (Source: URA)
URA reported that private residential rents fell 0.5% in the fourth quarter of 2025 after rising in the previous quarter. This may give renters a little more room, but it does not mean rent pressure has disappeared. If you are comparing options, it is still worth checking how each submarket is moving, because rental change was not the same across all areas.
HDB resale prices were largely flat in Q4 2025 (Source: HDB)
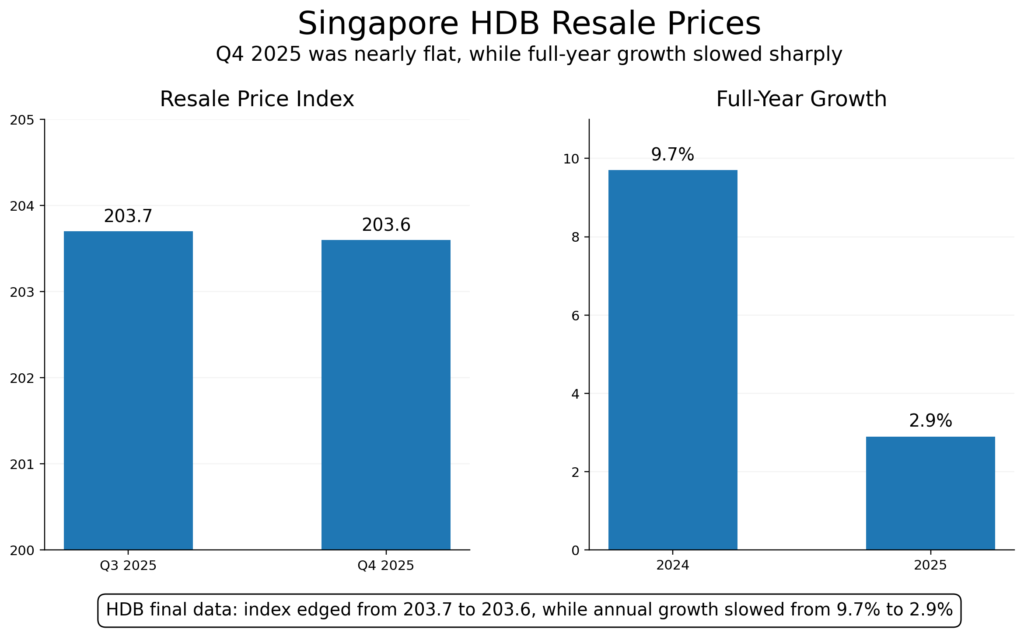
HDB said its Resale Price Index was 203.6 in Q4 2025, almost unchanged from 203.7 in Q3. Full-year resale price growth also slowed to 2.9% from 9.7% in 2024. This is worth watching because a calmer resale market can affect upgrader demand, buyer expectations, and how people compare public housing with private condos.
Singapore’s private residential vacancy rate fell to 6.0% in Q4 2025 (Source: URA)
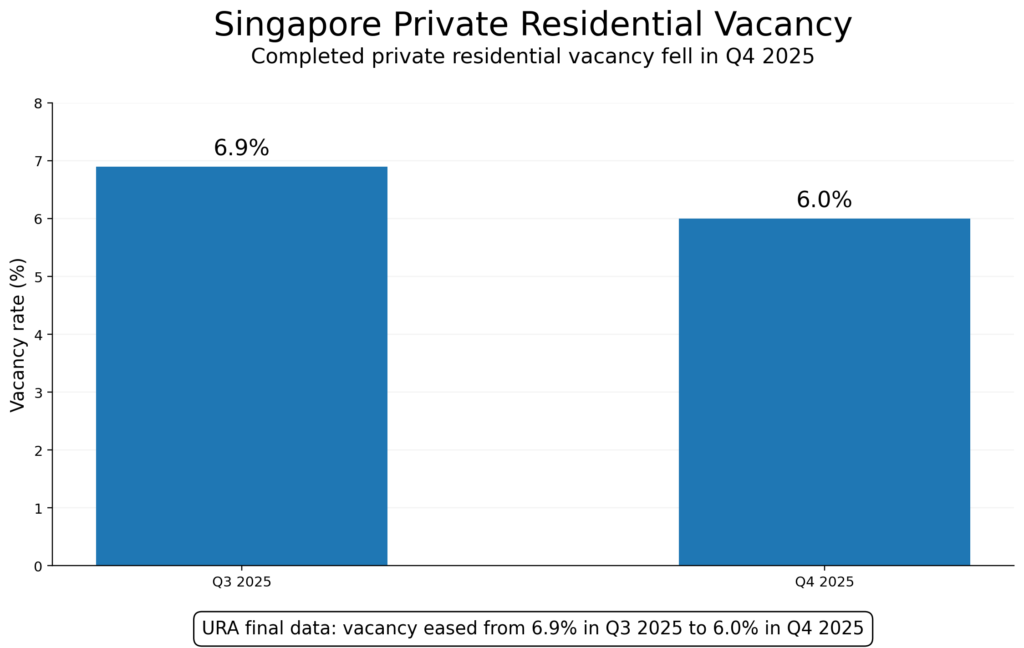
URA said the vacancy rate for completed private residential units fell to 6.0% at the end of Q4 2025, down from 6.9% in the previous quarter. Lower vacancy can support both rents and prices. If you are watching timing, this suggests supply is being absorbed, so it is still important to compare available stock carefully rather than expect a wide open choice.
Around 4,575 private residential units were placed on the Confirmed List for 1H 2026 GLS (Source: URA)
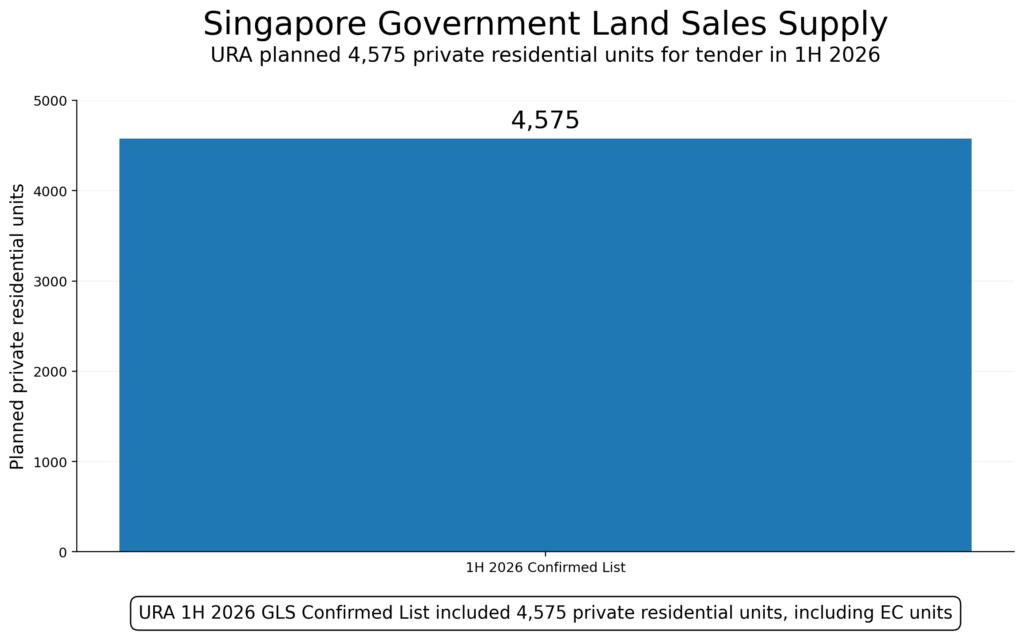
URA said 4,575 private residential units would be tendered through the Confirmed List of the first-half 2026 Government Land Sales programme. This is useful because future supply can shape price pressure over time. If you are looking beyond the next few months, planned supply is one of the things worth tracking before deciding how urgently you need to act.
Thailand Condo and Housing Statistics
Thailand’s housing market in 2026 looks more mixed than fast-moving. Some prices are still edging up, but the pace is not strong across every segment. Bangkok condos, broader home values, credit conditions, and future supply all matter here. That is why recent Thailand data is useful. It can help show whether the market is gaining strength, staying cautious, or becoming more selective.
The figures below focus on price movement, Bangkok condo trends, supply pressure, and financing conditions. These are worth checking if you want to compare timing, judge risk, or see whether a listing sits in a stronger or softer part of the market.
Thailand’s nationwide residential property price index reached 176.6 in January 2026 (Source: Bank of Thailand)
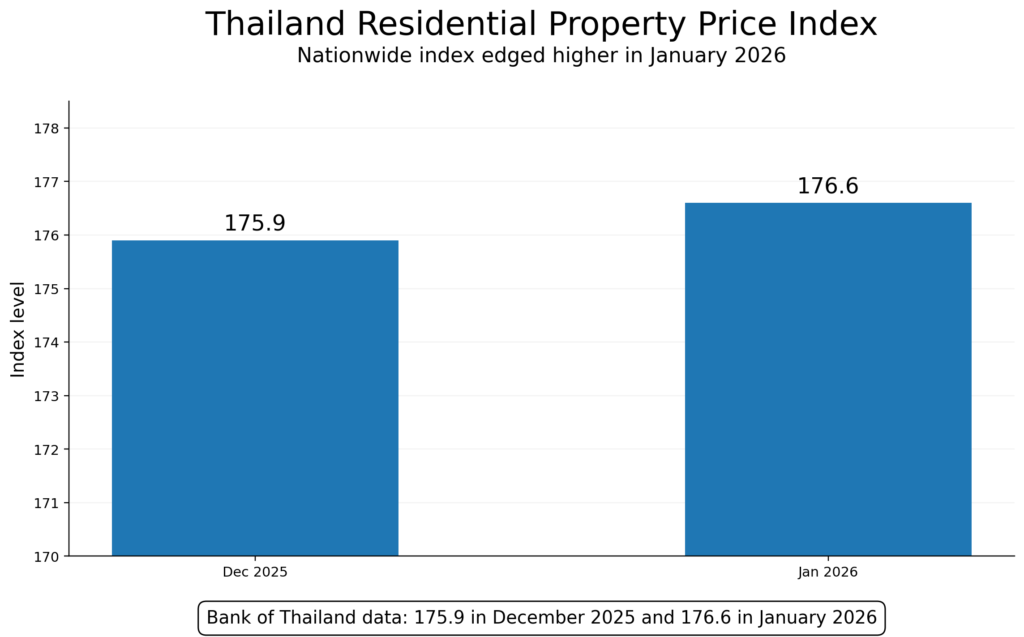
The Bank of Thailand showed the nationwide residential property price index at 176.6 in January 2026, up from 175.9 in December 2025. This points to continued price growth, but not a sharp surge. For buyers, that means the market is still moving upward, so it helps to compare value carefully rather than expect broad price drops.
Bangkok and vicinity condominium prices reached an index level of 205.2 in January 2026 (Source: Bank of Thailand)
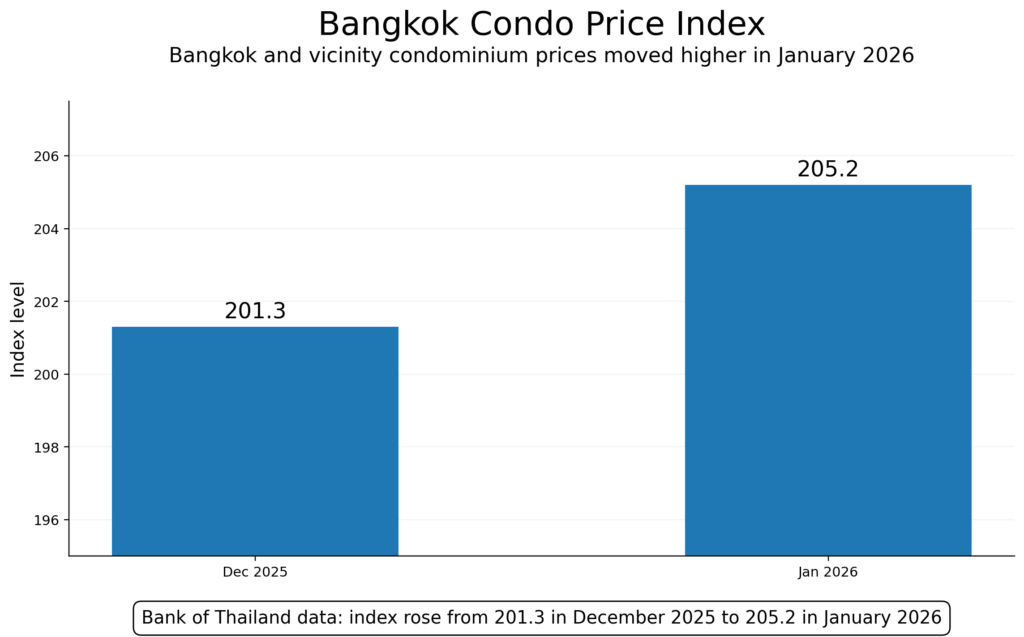
The Bank of Thailand also placed the Bangkok and vicinity condominium price index at 205.2 in January 2026. That was higher than 201.3 in December 2025. This is useful if you are watching Bangkok more closely than the national market. Condo prices there are still holding up, so location and project quality remain important when comparing options.
Luxury residential rents in Bangkok still showed year-over-year growth in Q4 2025 (Source: JLL)
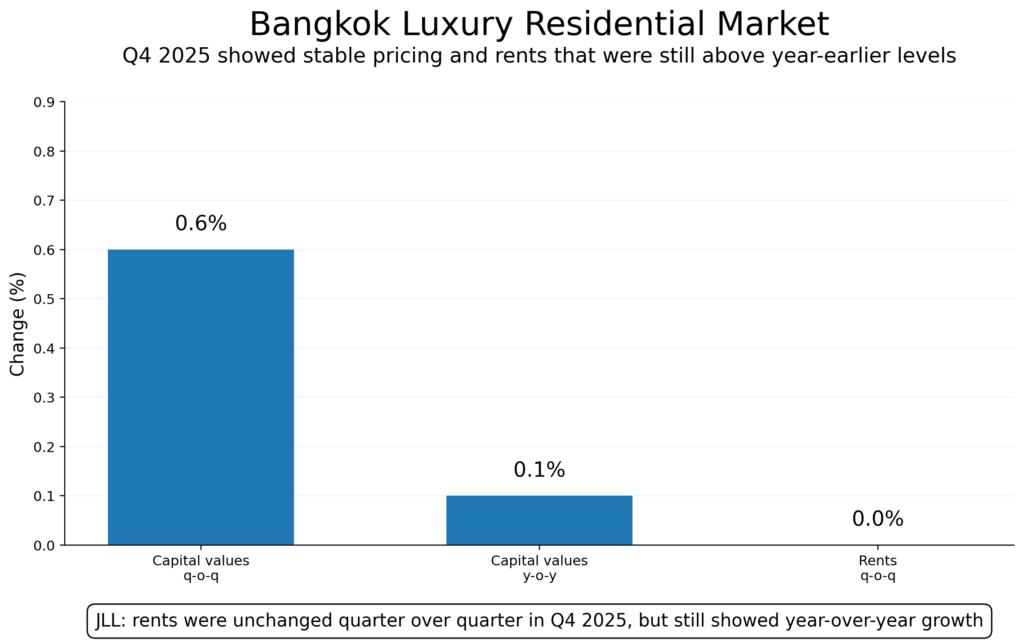
JLL said Bangkok’s luxury residential capital values stayed stable quarter on quarter in Q4 2025, while rents still showed year-over-year growth. This matters because rent strength can support pricing even when sale values stop climbing quickly. If you are comparing condo purchases, it is worth checking whether rental demand in that area is still giving owners pricing support.
Future condo supply sales performance in Bangkok declined in 2025 (Source: CBRE)
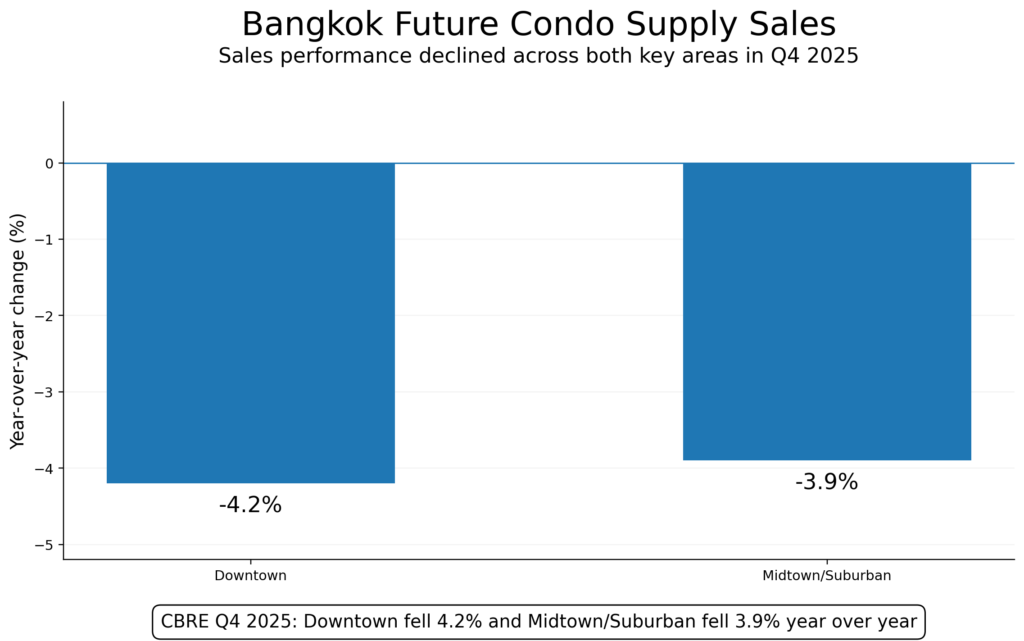
CBRE reported that future supply sales performance in Bangkok fell 4.2% year over year in the Downtown area and 3.9% in the Midtown and Suburban area in Q4 2025. This suggests buyers and developers were still facing pressure. If you are reviewing new launches, it helps to check whether demand is truly absorbing supply in that part of the city.
Thailand kept easier mortgage loan-to-value rules in place through June 30, 2026 (Source: Bank of Thailand)
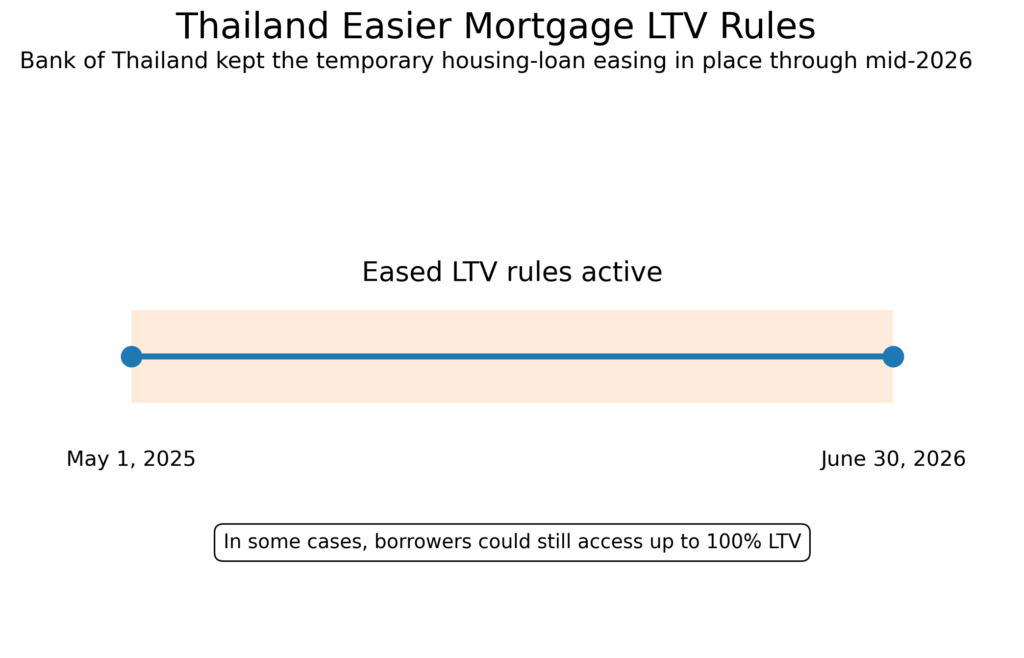
The Bank of Thailand said its eased LTV rules for housing loans apply to agreements signed from May 1, 2025 through June 30, 2026. In some cases, borrowers can still access up to 100% LTV. This matters because financing rules can affect who is able to buy and how much flexibility buyers still have in the market.
Malaysia Housing and Apartment Statistics in 2026
Malaysia’s housing market in 2026 looks active, but not simple. Some prices are still moving up. Financing is still a key part of the story. In some places, rent has gained support, while unsold stock is still worth watching. That is why recent Malaysia data matters. It helps show whether the market is becoming easier to enter or still needs careful comparison.
The stats and trends below focus on price movement, borrowing conditions, loan growth, rental direction, and overhang pressure. This can help buyers and renters judge whether they should move faster, compare more carefully, or watch local supply before making a decision.
Malaysia’s house price index reached 234.4 in Q4 2025 (Source: NAPIC data via Trading Economics)
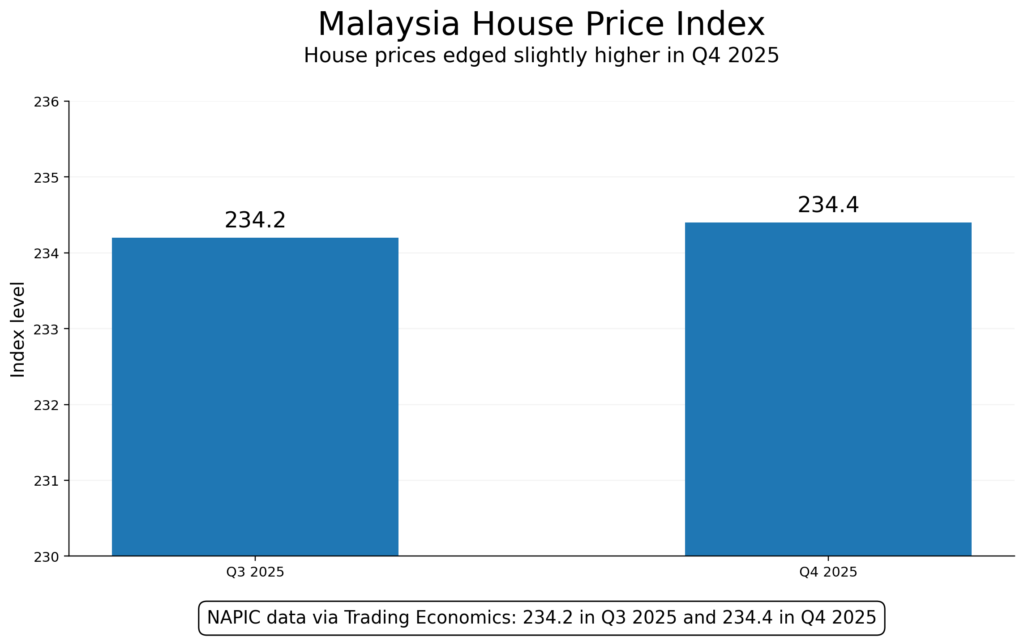
Malaysia’s house price index rose to 234.4 in the fourth quarter of 2025, up slightly from 234.2 in Q3 2025. This points to a market that is still moving upward, but not quickly. If you are comparing apartments or condos, this is a sign to focus on unit quality and location, not only on hopes of broad price drops.
Bank Negara Malaysia kept the Overnight Policy Rate at 2.75% in March 2026 (Source: Bank Negara Malaysia)
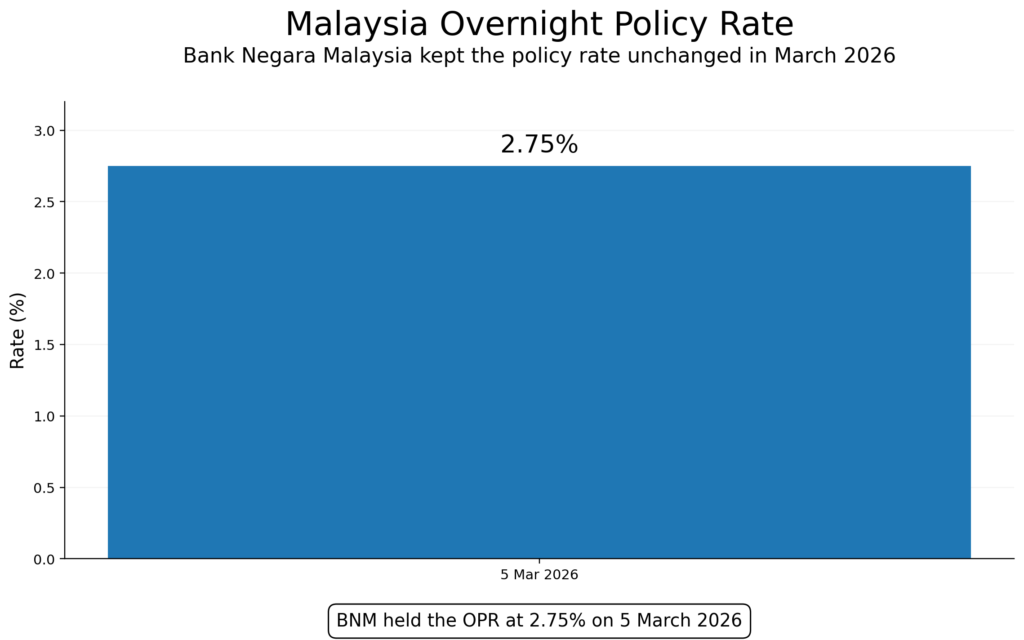
Bank Negara Malaysia kept the OPR at 2.75% on March 5, 2026. This matters because borrowing costs affect monthly payments and buyer confidence. If rates stay steady, buyers may get a more stable planning window. That still does not remove affordability pressure, so it helps to check loan terms carefully before committing.
Household loan growth in Malaysia stayed at 5.6% in January 2026 (Source: Bank Negara Malaysia)
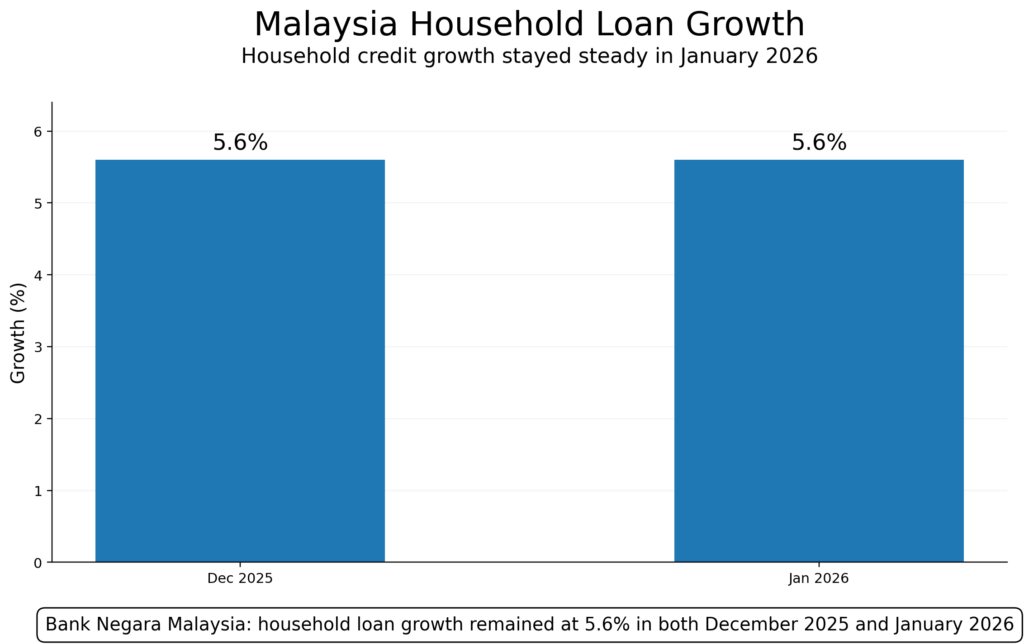
Bank Negara Malaysia said household loan growth remained stable at 5.6% in January 2026, unchanged from December 2025. This suggests housing-related borrowing has not fallen sharply. That is useful because steady credit growth can support demand. If you are watching the market, it means financing activity is still present, even in a more careful buying environment.
Prime Kuala Lumpur neighbourhoods saw rental growth of 5% to 10% in 2025 (Source: The Edge Malaysia, citing Knight Frank)
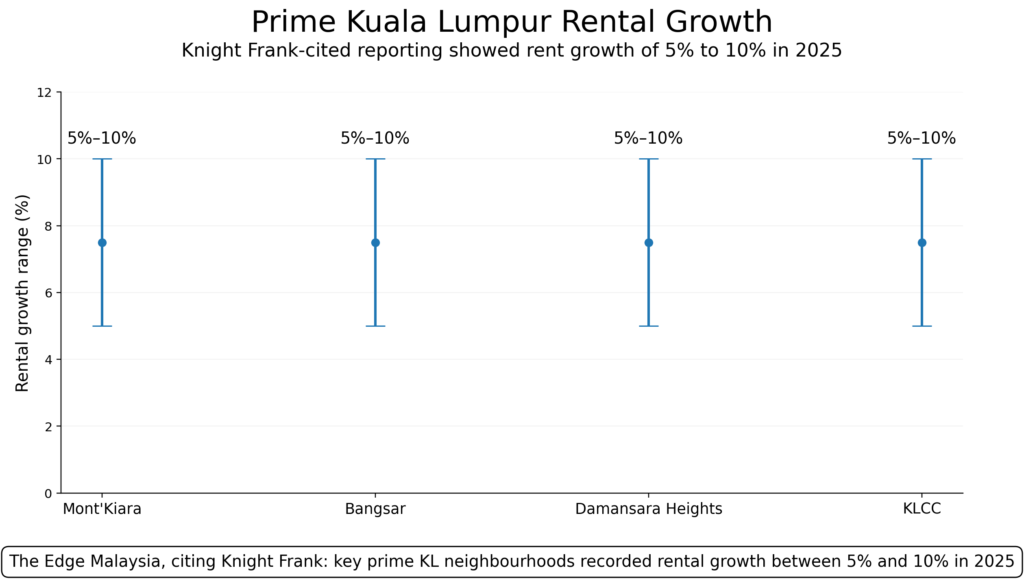
The Edge Malaysia reported that prime areas such as Mont’Kiara, Bangsar, Damansara Heights, and KLCC recorded rental growth of 5% to 10% in 2025. This matters because stronger rent can support owner interest and shape condo pricing. If you are comparing Kuala Lumpur locations, rent strength is one useful sign of where demand is still holding better.
Malaysia’s residential overhang reached 28,672 units in Q3 2025 (Source: Global Property Guide, based on JPPH figures)
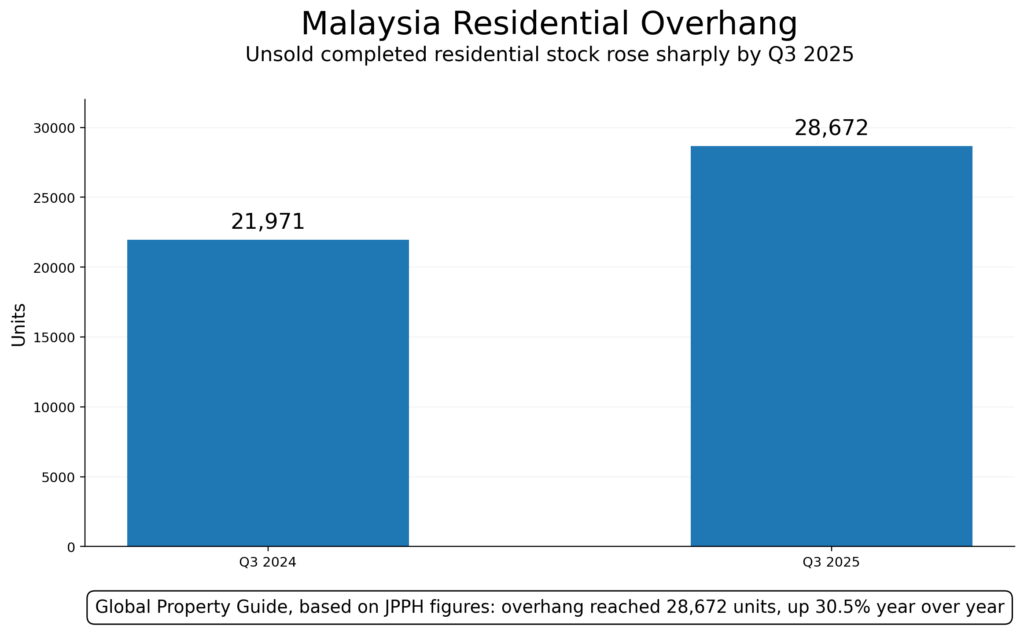
Global Property Guide reported that Malaysia’s residential overhang rose to 28,672 units in the third quarter of 2025, up 30.5% year over year based on JPPH figures. This is worth watching because unsold stock can affect pricing power and negotiation room. If a market has too much supply, buyers may have more space to compare and push for better value.
Conclusion
Condo and housing statistics in 2026 show that no market is moving in the same way. Prices, rent, supply, and buyer pressure can change from one region to another. That is why broad market headlines are not enough on their own. Good statistics help people ask better questions, compare options more carefully, and judge timing with more clarity. For buyers and renters, the real value is not just in the number, but in what that number may mean next.
Frequently asked questions about condo market statistics in 2026
Why should people look at condo market statistics in 2026?
Condo market statistics can help people see how prices, rent, supply, and demand are changing. This gives more context before they compare listings, locations, costs, and the timing of a possible move.
What can condo market statistics say about prices?
They can show whether prices are still rising, slowing down, or staying more stable. This can help buyers judge whether the market still looks competitive or whether there may be more room to compare options.
Why do rent statistics matter in a condo market guide?
Rent statistics help show pressure from the rental side of the market. They can help readers understand whether renting is becoming harder, softer, or still expensive in the places they are watching.
Why is recent housing data important in 2026?
Recent housing data gives a better picture of current market conditions. Older figures may miss newer changes in price movement, supply, financing, or buyer behavior, especially in markets that shift over time.
Why should people compare condo statistics by region?
Regional comparison matters because the market does not move the same way everywhere. One country may have rising prices, while another may have softer rent growth, higher supply, or different affordability pressure.